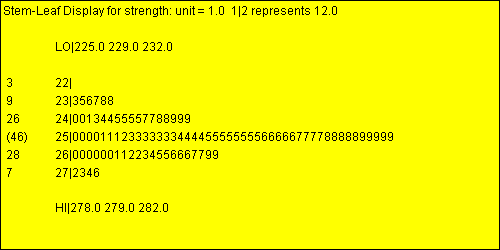
Purpose: Creates a stem-and-leaf display for a single column of numeric data. Allows Statgraphics to function as a stem-and-leaf plot generator.
DataSource: Any.

Read/Write Properties:
| Name | Type | Description | Possible Values | Default Value |
| depthCounts | boolean | Whether to add depth counts on the left of the plot. | true,false | true |
| flagOutsidePoints | boolean | Whether to add Hi and LO stems showing values unusually far from the others. | true,false | true |
| maximumLeavesOnStem | int | Maximum leaves before adding "...". | 1+ | 70 |
| maximumStems | int | Maximum number of stems in plot. | 1+ | 15 |
| minimumStems | int | Minimum number of stems in plot. | 1+ | 10 |
| tablewiseExclusion | boolean | Whether all rows of the data table containing a missing value in any column should be excluded from the plot. | true,false | false |
| xVariableName | String | The name of the column with data values to be plotted on the horizontal axis. | Any string. | "X" |
Other Public Methods
| Name | Description | Arguments | Return Value |
| int getNumberFarOutside() | Returns the number of far outside points. | None. | Number of data values more than 3.0 times the interquartile range from the box. |
| int getNumberOutside() | Returns the number of outside points. | None. | Number of data values more than 1.5 times the interquartile range from the box. |
| int getNumberOfStems() | Returns the number of stems. | None. | Number of stems. |

© 2025 Statgraphics Technologies, Inc.
The Plains, Virginia
CONTACT US
Have you purchased Statgraphics Centurion or Sigma Express and need to download your copy?
CLICK HERE