Statgraphics stratus

Stratus_logo_data_analysis_anywhere

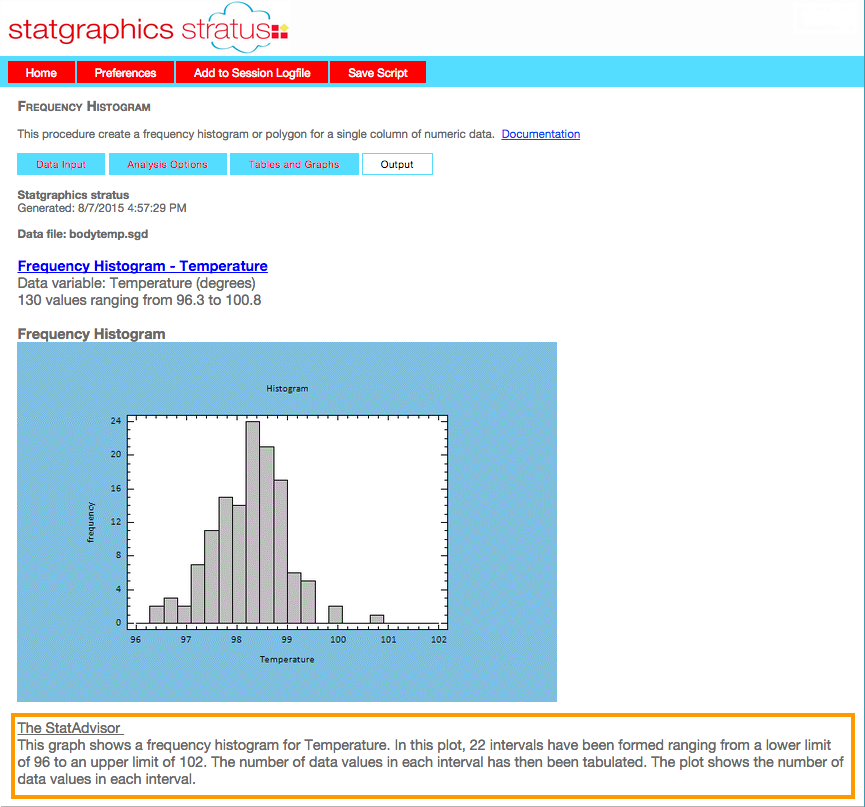
Statgraphics stratus is a version of Statgraphics that runs within a web browser as online statistics software. You can enter data directly into the data editor or read data from text files, Excel files, or other common formats to perform online statistical analysis. The calculations are performed remotely on a web server and the results are returned to your browser as HTML with imbedded graphics images.
stratus_cloud_data_analysis

Sign Up for Special Offers

stratus Online Data Analysis Features

  • Nothing to download or install. This online statistical analysis program runs within most web browsers. It works as statistical software for Mac, PC, iPad, tablet computer, or any device with a web browser.
  • Data may be entered directly into the STATGRAPHICS online statistics software datasheet, copied and pasted using your system clipboard, or read from text, XML, or Excel files.
  • All online statistical analysis calculations are performed by STATGRAPHICS .Net Web Services running on our servers or yours. Output is returned as HTML with graphs imbedded as GIF images.
  • You can copy all output to local applications using your system clipboard. You may generate output in English, French, German, Italian or Spanish.
  • Analyses may be saved as XML scripts and rerun at a later date.
  • A selection of interactive STATLETS® are also provided for dynamic data visualization.

 View brochure

Access

You can access STATGRAPHICS stratus online statistics software either as a guest or as a paid subscriber. Site licenses for online statistical analysis are also available for installing the product on one of your servers.

To try stratus statistical software online, go to www.statgraphicsstratus.com. The following costs and data limits apply:

  Cost Per Month Maximum Rows in Data File Maximum Columns in Data File Maximum Data Saved on Server Maximum Data Transfer per Month
Guest Free 100 10 10 files 100MB
Subscriber $495 Annually 10,000 1,000 100 files No limit
Server license Contact us No limit No limit No limit No limit

Need more information about our online statistics software? Speak with a Statgraphics stratus expert today to learn about online statistical analysis!

Contents

Plot
  • Scatterplots (X Plot, X-Y Plot, Multiple X-Y Plot, Bubble Chart, X-Y-Z Plot, Multiple X-Y-Z Plot, Matrix Plot)
  • Numeric Data (Frequency Histogram, Box-and-Whisker Plot, Quantile Plot, Normal Probability Plot, Multiple Boxplot)
  • Categorical Data (Frequency Table, Contingency Table)
  • Probability Distributions (General Distributions, Sampling Distributions)
  • U. S. Map
Describe
  • Summarize Data
  • Numeric Data (One Variable Analysis, Multiple Variable Analysis, Distribution Fitting)
  • Categorical Data (Frequency Tabulation, Crosstabulation)
Compare
  • Two Samples (Independent Samples, Paired Samples)
  • Multiple Samples
  • ANOVA (Oneway ANOVA, Multifactor ANOVA)
Relate;
  • Simple Regression
  • Multiple Regression
Forecast
  • Descriptive Time Series Methods
  • Smoothing
  • Seasonal Decomposition
  • Forecasting (Automatic and Manual)
SPC
  • Pareto Analysis
  • Capability Analysis
  • Control Charts for Variables (Individuals, Subgroups)
  • Control Charts for Attributes (P and NP Charts, U Chart, C Chart)
  • Weibull Analysis
  • Six Sigma Indices
Statlets
  • Scatterplot Brushing
  • Scatterplot Smoothing
  • X-Y-Z Scatterplot
  • Curve Fitting
  • Surface Fitting
  • Interactive Histogram
  • BIvariate Density Estimation
  • Power Transformations
  • Sample Size Determination
  • Interactive Map
  • Exponential Smoothing
  • Stock Price Plots
  • Probabilistic Fractal

User Guide

You may download the User Guide in PDF format.